|
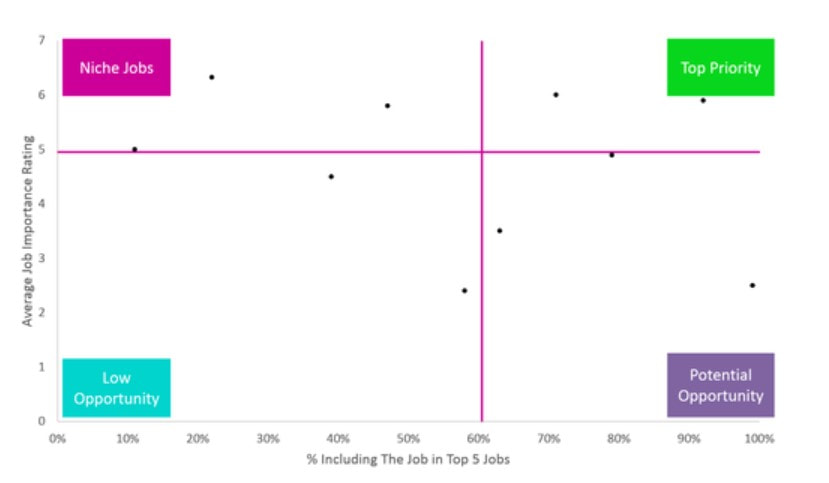
By Sylvia Brown Jobs to be Done (also known as JTBD or Jobs-to-be-Done) emphasizes deliberate, thorough qualitative research to understand a consumer’s true priorities. But how do we measure these jobs in a larger population where we can’t speak with every customer directly? What should a Jobs to be Done survey and survey analysis look like? This post takes a deeper look at the quantitative methods that pair those rich consumer insights with the numbers to back them up. Although logistic and other regressions deserve a place in any marketing analysis toolbox and can be precursors to the methods below, they are by no means the be-all and end-all of quantitative techniques. This post will outline four quantitative methods that go beyond standard regressions and are well-suited to Jobs to be Done research. These four methods — quadrant analysis, conjoint analysis, clustering, and principal component analysis (PCA) — are excellent strategies for getting the most from a Jobs to be Done survey. Quadrant analysis Quadrant analysis is the most adaptable and straightforward method included here. It’s a simple idea: plot two factors on a grid and create a 2x2 matrix by drawing lines at the median of each axis. These two factors could be anything you’d like to compare; we typically compare the importance of a feature against consumers’ ratings of a brand’s performance on that feature. While useful for addressing these brand positioning questions, quadrant analysis also lends itself well to answering more nuanced questions around consumer jobs. For example, let’s imagine we put out a survey that asks couples what they’re looking to get done by going to a restaurant together. A first question asks them to select their top five highest priority jobs from a longer list, and a later question asks them to rate these top five jobs on an importance Likert scale from 1 (Not at all important) to 7 (Extremely important). By graphing the responses to this question on a 2x2 matrix, we evaluate these jobs along two dimensions at once to identify both niche and common jobs among this consumer. Though job prevalence and job importance are both crucial metrics to measure in a survey, their relationship to each other reveals much more about consumer priorities than each metric in isolation. Quadrant analysis therefore gives us an intuitive, precise system for deciding which jobs to innovate around. Conjoint analysis One of the best uses of a Jobs to be Done survey is to identify the pain points a consumer has when using a service or product. Pain points are problems that inhibit a customer’s ability to get a job done — things that customers find inefficient, tedious, boring, or frustrating. These are best uncovered through deep qualitative research, but once a diverse set of pain points has been established, a survey can map pain points to consumer segments and identify the most prominent pain points. Conjoint analysis is one of the better ways to identify which pain points consumers see the most value in alleviating. Though there are several variations of conjoint analysis — adaptive, choice-based, and full-profile to name just a few — the aim of each variation is to force a choice between different products or services to predict which features consumers value most. Conjoint analysis can be used to test which pain points are most “painful”, and therefore which a consumer would pay more to alleviate. For example, let’s say we identify two major pain points around ice cream: 1) ice cream melting too quickly and 2) guilt for consuming too many calories. Would our consumer pay more for ice cream that melts more slowly than they would for low-calorie ice cream that tastes as delicious as its more caloric counterpart? Including conjoint analysis questions in our survey gives us a sense of where innovative, valuable solution areas lie. Clustering Clustering is perhaps the most sophisticated analysis included in this list, despite modern programming having made it seem deceptively simple. You can conduct cluster analysis by simply plugging in a list of variables and letting your program do the work for you. However, it should not be rushed into; much of the work of clustering comes before running the appropriate program. Without getting into the details too much, there are a few key things to keep in mind. First, clustering requires the researcher to develop a thorough “feel” for the data by running a number of descriptive statistics and data visualizations beforehand. Close attention should be paid to any variables that display collinearity, or variables that behave so similarly that their values can be used to predict one another with statistical significance. If you include highly multicollinear variables in your clustering, you essentially “double-count” for a job in the cluster analysis and therefore assign it more importance than it has. The number of variables included in the clustering should also be considered. A consumer may get upwards of forty jobs done with their favorite outfit, but clustering on too many variables implies undetected multicollinearity and, perhaps more importantly, makes interpretation very difficult. If done carefully, clustering can be used to identify patterns in jobs between consumers. For example, clustering on importance ratings of several jobs helps uncover which jobs appear together. Once the data is clustered, you can compare the job drivers (which include attitudes, backgrounds, and circumstances) between cluster members in order to identify consumers who prioritize certain jobs. The inverse is also possible: clustering on attitudinal measurements, such as job drivers, and seeing which jobs are most important to members of each cluster. Principal component analysis PCA is a data reduction technique that can simplify long lists of jobs for improved clustering. As I mention above, clustering works best on relatively few variables that are not multicollinear. So what do you do if you have a large set of jobs, some of which are highly correlated? How do you know which jobs to keep and which to exclude? Running a principal component analysis is one of the stronger solutions. PCA recombines variables — in our case, importance or satisfaction of jobs — into a new, smaller set of “components”, which are uncorrelated. An example of a PCA result is below. In each column are the “factor loadings”, which are similar to regression coefficients; the higher the factor loading, the more that observed variable “contributes” to the final factor. However, discussing “Factor 1, “Factor 2”, and “Factor 3” won’t hold anyone’s attention in a marketing meeting. Fortunately, there are often ways to rename factors to make them more intuitive. For example, if “look my best”, “feel attractive”, and “receive compliments about my appearance” are three variables with high factor loadings on Factor 1, we could title Factor 1 “Appearance-oriented”. Ultimately, PCA helps prepare data for clustering, but also distills granular quantitative insights into more manageable concepts and categories In summary
The work of these quantitative methods should begin even before the survey is written; designing surveys to ask the right questions and enable the right analysis makes the most of consumer findings. There are few research mistakes as painful as wrapping up an expensive survey only to realize it hasn’t given you the data you need to answer your key questions. Before writing the survey, it is important to outline exactly what questions you need answered and, from there, which methods are best suited to answering them. Fortunately, most standard survey question formats, like Likert scales, lend themselves to a wide variety of analytical methods, but other analyses, like conjoint analysis, require questions to be carefully prepared, sometimes using separate software. Taking the time to ask yourself what you want your final analysis to achieve can help save you from the headache of dealing with unproductive data down the road. Pairing thoughtful quantitative analysis with rich qualitative findings turns powerful stories into nuanced and actionable steps forward. In the case of Jobs, there are many ways in which qualitative research helps fill in the gaps of quantitative research, and vice versa. By beginning with broad qualitative inquiry, we let the consumer lead us to their jobs in their own words, rather than asking them about jobs or other elements of the Jobs Atlas we assumed were relevant. Once the survey is fielded and analyzed, previous qualitative research then explains the ‘why’ behind the numbers that a survey gives us. Conversely, a survey finds the underlying trends and patterns in the Jobs Atlas, turning the individual personas you explored in your qualitative work into a map of your market opportunity. Using mixed methods research, particularly with a focus on jobs, produces practical understandings you can use to outline the path to your next great innovation. Comments are closed.
|


5/3/2018